| Title | On basic research “Bio-Normalizer Effects on Nitric Oxide/Superoxide Balance and Ultrastructural Changes in the Experimental Model of Streptozotocin-lnduced Diabetes” |
|---|---|
| Year | |
| Author | V. Banin; M.Donskova; E. Ostrachovitch; I. Deeva; L. Korkina |
| Publisher | Presented at the 2nd International Conference on Natural Antioxidants and Anticarcinogens in Nutrition, Health and Disease (NAHD’98); Helsinki, Finland; June 24-27, 1998 |
Final Report
On basic research “Bio-Normalizer Effects on Nitric Oxide/Superoxide Balance and Ultrastructural Changes in the Experimental Model of Streptozotocin-lnduced Diabetes”
Principal Investigators -Professor Victor Banin, Head, Lab. Electron Microscopy, Russian State Medical University;
Dr. Marina Donskova PhD, Senior Researcher, Lab. Electron Microscopy, Russian State Medical University;
Dr. Elena Ostrachovitch PhD, Lab. Antimutagenesis, Russian Institute of Pharmacology;
Dr. Irina Deeva PhD, Lab. Cell Biophysics & Biochemistry, Russian Institute of Pediatric Hematology
Scientific Supervisor– Professor Ludmila Korkina, Head, Lab. Molecular Biology Biochemistry, Russian State Medical University
ABSTRACT
This study was designed to further calculate the cellular and molecular mechanisms of beneficial clinical effects of Bio-Normalizer on diabetes mellitus. For the purpose, the experimental model of streptozotocin-induced diabetes in rats was used. The male Wistar rats were injected with 45 µg of streptozotocin (STZ) intravenously. Starting from the third day after injection, the experimental group of animals (n = 15) was given BN (100 mg/kg of weight) for one week, and the control group (n = 12) was given the pure glucose (100 mg/kg weight for one week). The animals of both groups were sacrificed under phenobarbital narcosis at the third and tenth days of experimental procedure. The following parameters were analyzed: glucose level in the blood; nitric oxide and superoxide production by peritoneal macrophages and circulating granulocytes; lipid peroxidation and glutathione content in red blood cells (RBC); lipid peroxidation and structural abnormalities in pancreas and brain. We found a three-fold increased glucose level in STZ-treated rats at the third day after STZ injection. The microscopical examination revealed that STZ injection led to the development of acute inflammation reaction in endocrine part of pancreas, reversible damage of islet β-cells, and increased construction of islet capillaries. There were increased release of NO from macrophages (2-and 1.5-fold increase at the third and tenth days, respectively) and highly suppressed NO production by circulating leukocytes. The peritoneal macrophages of diabetic rats produced slightly higher than normal levels of superoxide spontaneously as well as being activated by phorbol ester (PMA) as was revealed by cytochrome c reduction. Activation by PMA resulted in the increased production of O2-by diabetic leukocytes. Significantly suppressed lipid peroxidation in both liver and pancreas and increased lipid peroxidation in RBC accompanied the development of diabetes. There was a simultaneous GSH depletion in RBC. BN but not glucose administration decreased substantially the glucose level in the blood of diabetic rats, prevented vascular abnormalities in β-islets, restored the normal NO and superoxide production by peritoneal macrophages and blood granulocytes, and normalized the GSH level in red blood cells. At the same time, BN did affect the intensity of lipid peroxidation neither in liver nor in pancreas nor in red blood cells.
INTRODUCTION
Reactive oxygen species are always generated in the process of energy especially glucose metabolism [I]. Although there is a well-developed network of defense systems against reactive oxygen species (ROS) localized intra-and extracellularly when the free radicals generated exceed the capability of the defense systems excessive harmful ROS can locally cause cell or tissue damage [2]. On the other hand it has been proven in recent studies that ROS play an essential role in a number of physiological processes [3]. Due to this, the deficiency of one or another ROS can lead to impaired metabolism and physiology. Despite of the fact that the role of ROS in pathogenesis of diabetes mellitus has been extensively investigated last decade the precise mechanism and dynamics of ROS formation and degradation in human or animal organism suffering from diabetes remain obscure. Thus the increased superoxide and hydrogen peroxide production and reduced degradation of ROS have been reported for the early stage of IDDM in humans [4]. At the same time, advanced IDDM and NIDDM have been reported to have suppressed levels of ROS generated by circulating blood cells [5]. It has been proposed that ROS overproduction by circulating phagocytes and tissue macrophages could be responsible for pancreatic islet [6] and endothelial cell injury since ROS are emitted mainly by phagocytes and β-cells as well as vascular cells are particularly susceptible to oxidative damage [7]. On the other hand, both superoxide and nitric oxide being produced in appropriate amounts possess numerous essential physiological functions that makes NO is known as endothelial released factor of vuscular relaxation [8] and potent neurotransmitter [9]. Nitric oxide has also been found to play an important role as a signal molecule in many parts of the organism as well as a cytotoxic molecule of the nonspecific immune response. The molecule NO is synthesized on demand after enzyme activation, either by constitutively expressed family of NO synthases (NOS) for a short period of time (seconds to minutes) or by an inducible nitric oxide synthase (iNOS) that, once expressed produces NO for hours and days. Although being a radical NO has quite a long life in biological systems which depend on concentrations of NO itself, oxygen and SH-containing compounds in the environment. There are several protein targets for NO at the surface or within the plasma membrane such as signaling and transport proteins and membrane receptors. Meantime, reactions of NO with surface receptors have not been reported, with the exception of the neuronal NMDA receptor-channel complex [9].
In the light of all these findings, it seems reasonable to suggest that Clinical complications of diabetes mellitus could be at least partly explained by impaired homeostasis of ROS production and decomposition. To ameliorate or even avoid some of diabetic complications, a lifelong management strategy which includes non-toxic regulators of oxidant/antioxidant balance in the body should be developed.
Basing on our previous results, which showed positive clinical effects of BN on both types of diabetes mellitus in humans [10], and taking into account some data obtained in the in vitro experimental systems [11]. we suggested that BN could prevent and/or heal the damages to pancreas and organism in general induced by streptozolocin. Streptozotocin is an antibiotic with highly specific toxicity against β-islets of pancreas [12].
MATERIALS AND METHOD
Reagents
L-arginine, SOD, cytochrome c. phorbol-12-myristate 13-acetate (PMA), GSH, GSSG- reductase (type III EC 1.6.4.2), 5.5″-dithio-bis-2-nilrobenzoic acid (DTNB) and zymosan were purchased from Sigma (St. Louis, MO. USA). L-NMMA (N-monomethyl-L-arginine), Griess reagent, streptozolocin, TNF-α, lipopolysaccharide and antibodies for inducible nitric oxide synthase (iNOS) were from Alexis Inc. (Switzerland). All other reagents were of analytic grade or better.
Animal Procedures
Animal care standards and experimental protocol were in accordance with the EC guidelines. Thirty male Wistar rats of 200-250 g of weight were housed on sawdust in cages, five rats per cage and maintained on n 12:12 h light-dark cycle. All animals received food and water ad libitum. Diabetes was induced in 20 rats with STZ 45 mg/kg i.v. (Alexis, Switzerland). Diabetes was confirmed after 72 hours by measuring whole blood glucose levels using a rapid glucose sensor system (Medisense, Amersfoort, The Netherlands). Three days after STZ injection, the diabetic rats were divided into two groups, one of which was given BN (100 mg/kg body weight) for one week and another one remained on standard diet. Three groups were studied: normal controls (C, 10 animals), diabetic (D, 10 animals) and diabetic + BN (DBN 10 animals). Animals of groups C and D were decapitated at 3d and 10th day and those of group DBN at 10th day after STZ injection. Blood was subsequently collected in heparinized tubes and processed immediately. Pancreas, liver, duodenum, and brain were removed and examined biochemically and morphologically. Tissue homogenization was performed on ice in a 0.1 M potassium phosphate buffer (pH 7.4) on the same day.
Isolation of Cell
The circulating granulocytes were isolated from the freshly drawn blood samples using gradient centrifugation in Ficoll-hipaque (r = 1.072) at 400 x g for 40 minutes. The granulocyte-containing fraction was washed twice in a big volume of PBS without calcium and magnesium. Alter hypo-osmotic lysis of contaminating erythrocytes, cells were resuspended in phosphate-buffered saline (PBS. pH 7.4). washed twice in the same buffer, and finally placed into PBS containing 10% of heat-inactivate calf serum. Differential cell counts were performed microscopically after nonspecific esterase staining, giving more than 80% of PMNs and the remaining consisted of lymphocytes and monocytes. Viability of the cells was assessed by the trypai1 blue exclusion test and was above 90%.
Macrophages were isolated from the peritoneal lavage fluid by centrifugation at 400 x g for 10 min. The cell pellet was washed twice and cells were placed into Petri dishes and incubated at 37°C for 1hour to allow macrophages to adhere. Then, supernatant was descanted, and adhered macrophages were scraped by ribbon shovel and resuspended in HBSS containing 1% of BSA. Differential cell count was performed microscopically and revealed more than 95% macrophages in the suspension. The remaining 5% were lymphocytes and mast cells. Cell viability was assessed by the trypan blue exclusion test and was above 98%.
Measurements of nitric superoxide formation
Peritoneal macrophages or PMNs (1 x 10⁶ cells per tube) were stimulated with PMA (10 ng/ml) or opsonized zymosan (2 mg/ml).Cytochrome c (50 UM) L -arguine (0.6mM), L-NMMA (0.6 mM) and SOD (50 U/ml) were added when indicated to give a final volume of 1 ml. After incubation for 60 min at 37°C in a water bath reaction was stopped by immersing the tubes in ice and cold centrifugation. The supernatant was used to measure nitric oxide and superoxide formation. Nitrite in the supernatant was measured as a parameter of nitric oxide formation [13]. Aliquots of 0.4 ml were incubated with 0.4 ml Griess reagent (0.1% N-(1-naphtyl)-ethylenediamine and l% sulfanilamide in 2.5% H3PO4) at room temperature for 10 min. The absorbance was measured at 550 nm in comparison with incubating medium without cells. Sodium nitrite was used as standard.
Superoxide production was determined as SOD-inhibitable reduction of cytochrome c [14]. After incubation the cultured medium was transferred to cuvelles for cytochrome c determination at 550 nm using the extinction coefficient of 21 mM-1cm-1
Results were expressed as nmol of nitrite and superoxide produced by 1 x 10⁶ cells.
Thiobarbituric acid-reactive substances
TBARS were measured in tissue homogenates or in erythrocytes using the method of Andersen et al. [15]. Aliquots or homogenates or hemolysates (0.5 ml) were mixed with 0.25 ml trichloroacetic acid and centrifuged at 3000 x g for 10 min. One-half milliliter of supernatant was then mixed with 0.25 ml of 0. 7% TBA in a water acetic acid solution (1: 1, v:v) and boiled for 30 minutes. After cooling on ice for 2 minutes, absorbance of the samples was read at 532 nm in comparison to a standard curve prepared using 1,1,3,3- tetraethoxypropane (Sigma. St. Louis, MO. USA.). Using a molor absorbtivity value of E532 = 153,000 mol-1 results were expressed as nmol TBARS/g tissue (wet weight) or nmol TBARS/g Hb.
Glutathione Measurements
Total glutathione (GSH + GSSG) was measured essentially as described previously [16] Glutathione was extracted from red blood cells into 400µl of 10% trichloroacetic acid solution. Then, 10-15 µl or the samples were incubated with 1 ml of 0.2 M PBS (pH 7.5) containing 6 mM DTNB, o.2 mM NADPH and glutathione reductase (1U/ml) for 30 min at 37°C and the absorbance at 412 nm was measured. Standard GSH samples prepared in 10% trichloroacetic acid were measured simultaneously. The lower-limit of GSH+GSSG detection by this method is reported to be 1-10 ng/ml of assay mixture.
Microscopical examination
To evaluate the ultrastructure changes in the rat tissues, the light microscopy, transmissible electron microscopy (TEM) and quantitative measurement of histological sections were used. The tissue samples were taken from the pancreas jejunum, liver and brain. For light microscopy tissue specimens were fixed in Bouin”s solution or in a 10% buffered formaldehyde (pH-7.3). Tissue sections for histological examination were serially mounted into paraffin and stained with both hematoxilin-eozin (HE) and aldehyde-fuschine (the highly selective dye for B-cells). The histological preparations of pancreas were used for morphometry analysis. The partial areas of Langerhans’s islets and β-cell content in them were determined. The morphometrical data were evaluated statistically. The samples for electron microscopy were fixed initially in a 2.5% buffered glutaraldehyde (pH-7,4) with 0.1 M phosphate buffer and then, in osmium tetroxide for 1 hour. The embedding was done using Epox 812, and sections were prepared and stained subsequently with uranyl acetate and lead citrate. Finally the sections were examined on a Hitachi electron microscope at an accelerating voltage of 65k V.
Inducible nitric oxide synthesis (iNOS) measurements
Intracellular iNOS distribution and expression were detected by immunohistochemical method using experimental procedures described by manufacturer (Alexis Corp., Switzerland). Briefly, the formalin fixed and paraffin embedded pancreas and brain sections were heated at 60°C for 35 minutes. Then they were deparaffinized in 100% xylene at the same temperature for 35 minutes. The section hydration was restored in graded ethanol starting from absolute spirit. The activity of endogenous peroxidase was blocked by incubating sections in 3% H2O2 in absolute methanol for 10 minutes at room temperature. The rehydrated and blocked sections were thoroughly rinsed in PBS, pH 7.5. After washing procedure they were incubated with diluted primary antibody against iNOS overnight at 4°C in humidity chamber. Finally, sections bound to iNOS antibody were exposed to secondary polyclonal antibodies loaded with horse radish peroxidase for 10 minutes at room temperature. To examine microscopically, the sections were stained by neutral red dye.
Statistics
Data were analyzed by the Student’s t-test to identify significant differences. Results were expressed as means for four to six separate experiments, performed in duplicate, with corresponding standard errors.
Results
In the very first experiments we attempted to evaluate the in vitro effects of both STZ and its combination with BN on the luminol-dependent chemiluminescence (LDCL) of peritoneal macrophages. It was shown that STZ, being added to isolated macrophages at concentration 2mg/ml, which corresponded to pancreatoxic concentration of STZ used in the further in vivo experiments, enhanced significantly the intensity of spontaneous LDCL with a simultaneous decrease of zymosan-activated LDCL (Table 1). In the presence of BN (2mg/mL) the intensity of STZ-stimulated spontaneous LDCL became normal while zymosan-activated LDCL practically did not changed.
Table 2 and Fig. 1 show that single intraperitoneal STZ injection induced an early sharp increase of blood glucose level (3d day after STZ challenge). The glucose content slightly declined in the control group of animals by the 10th day of experiment. At the same time, the content of glucose in the blood or the experimental group rats was found in the normal range of values.
The morphological analysis of different organs such as pancreas, brain, jejunum, and liver confirmed that pancreas is a specific target for STZ action. In the present study we failed to reveal any pathological changes in all above organs except for pancreas. However, some distinct symptoms of damage to microvessels (capillaries), for example, microvascular dilatation and increased local permeability were observed in the brain and jejunum of diabetic rats during entire period of the observation (Data not shown). At the same time, there were no any pathological changes in the ultrastructure of brain and jejunum tissues.
Specific STZ-induced destruction of the pancreatic insular tissue (Group D) is shown on Micrographs 1-5. These early diabetic features comprise acute inflammation with vascular dilatation and massive invasion of granulocytes, lymphocytes and activated macrophages to the marginal area of islets (Micrograph 1A and 5); the loss of β-cells (Micrograph 1 B); interstitial oedema and degenerative changes in the remaining β-cells (Micrograph 3); and subtotal damage of b-insular complex which characterized by necrosis of β -and exocrine cells (Micrograph 4). While the vast majority of β-cells was destroyed in STZ-group, the A-and D-cells of the pancreas remained unchanged (Micrograph 2). As a result, the partial area of islets was dramatically decreased up to the 4th day after STZ injection (Fig. 2) and those islets were catastrophically deprived of structurally and functionally normal β-cells. Thus, β -cells contain few secretory granules located at the long distance each from other. Collectively all these STZ-induced structural changes in pancreas can be regarded as a morphological basis for the development of insulin-dependent diabetes found in the experimental animals. The comparative morphological analysis of pancreas from rats of Group D and DBN showed significant difference between these two experimental groups. Thus, by the 10th day after STZ injection the Group D rats contained very few β -cells in the islets and pronounced predominance of normal A- and D-cells was observed (Micrographs 6 and 7). B-cells beard distinct features of degeneration such as cytoplasmic vacuolization and mitochondria swelling though definite regeneration in the structure and functions of exocrine tissue were found (Micrographs 7. 9 and 8 respectively). BN treatment of diabetic rats (Group DBN) led to the appearance of structurally normal islets (Micrograph 10) abundant with functionally active b-cells (Micrograph 11), which contained numerous secretory granules (Micrograph 12). There was a plausible increase both partial area of islets tissue and percentage of b-cells in the islets (Fig. 2). Most of the islets bear structurally normal b-cells with the signs or intracellular hypertrophy similar to the normal hyperactivated b-cells (Micrograph 13 and 14). Both inflammatory and microvascular disorders disappeared (Data not shown).
We attempted to elucidate the mechanism of STZ-induced damage to b-cells. It is thought that tissue macrophages, being challenged with STZ, produce greater than normal amount of reactive oxygen species, which in turn cause the oxidative damage of particularly susceptible b-cells. Indeed the measurement of superoxide and nitric oxide production by peritoneal macrophages revealed that NO release was substantially increased in STZ- treated rats and the level of NO was as twice as higher than in the control group by the 10th day of experiment (Table 3 and Fig. 3). Bio-Normalizer administration led to statistically significant decrease of NO production by tissue macrophages (Table 3 and Fig. 3). At the same time superoxide generation by macrophages was slightly increased in diabetic group of rats and BN practically did not affect the parameter except significant enhancement of PMA-activated superoxide production by cells (Table 4 and Fig. 4). Interestingly enough, the superoxide levels in macrophages of all three groups of animals investigated was connected somehow with NO generation by the same cells, which was shown using L-arginine as a specific substrate for NO-synthase and L-NAME as a competitive inhibitor of nitric oxide synthase (Table 5 ). The data collected in this Table demonstrate suppression of PMA-activated superoxide release in the presence of NO- synthase substrate and elevation of its level in the presence of NO-synthase inhibitor for two groups studied C and DBN. Similarity between effects of both inhibitor and substrate for NO-synthase on spontaneous superoxide generation for those two groups was found as well. The effects of L-arginin and L-NAME on spontaneous and PMA- activated superoxide production by diabetic macrophages (Group D) were opposite to those for the control (C) and diabetes plus BN (DBN) groups.
Induction of experimental diabetes resulted also in the characteristic changes of reactive oxygen agents produced by circulating blood granulocytes. Thus, nitric oxide production was below detectable level at the third day after STZ injection and slightly restored by the 10th day (Group D). Contrary to this, in the Group DBN granulocytes produced practically normal amount of nitric oxide and this production was highly sensitive to the action of NO-synthase inhibitor (Table 6). Circulating granulocytes of diabetic rats activated by PMA generated more than normal level of superoxide while spontaneous superoxide production remained in the normal range of values (Table 7). BN additionally increased PMA-activated superoxide production and did not influence the spontaneous one.
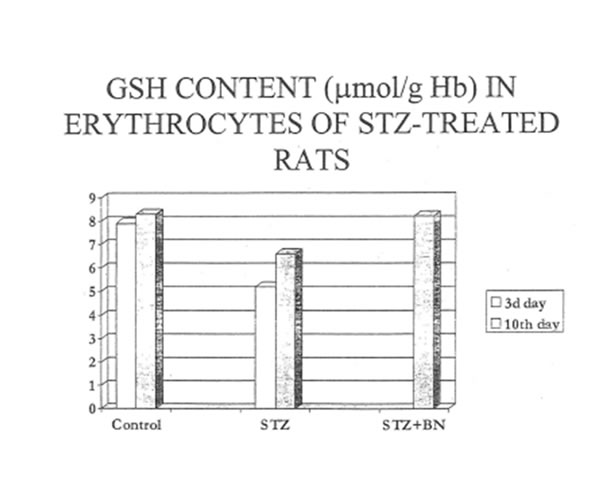
The disturbances in reactive oxygen species production by phagocytozing cells found for diabetic rats might induce lipid peroxidation in pancreas, liver and circulating erythrocytes, Therefore we studied the effects of STZ-and STZ+BN-treatment on the content of lipid peroxidation products in the tissues and red blood cells. To our surprise, STZ-treatment (Group D) did not increase hut did suppress the lipid peroxidation in both target organs: the pancreas and liver (Tables 8 and 9. Fig. 8). Additional treatment with BN (Group DBN) did not change the intensity of lipid peroxidation in these organs. At the same time, STZ-injection led to increase as compare to normal lipid peroxidation in erythrocytes at the very early stages of diabetes (3d day). Its level gradually decreased by the 10th day of experiment. Again, we failed to find any correcting effects of BN (Group DBN) on the intensity of lipid peroxidation in erythrocytes (Table l 0 and Fig. 9). The prooxidative effect of STZ on the erythrocyte membranes could be explained by depletion of reduced glutathione in the red blood cells. Table 11 and Fig. 10 shows that BN increase substantially GSH content erythrocytes of diabetic rats.
DISSCUSSON
Increased oxidative damage and changes in antioxidant capacity have been described in experimental diabetes, and have been associated with the development of diabetic complications. The purpose or the study was to elucidate the effects or natural antioxidant and immunomodulator BN on glucose level nitric oxide and superoxide production by phagocytozing cells, lipid peroxidation in erythrocytes and tissues and structural and functional abnormalities in pancreas. We found that BN treatment or the rats with STZ induced diabetes resulted in tremendous normalization or glucose level in the blood which was the consequence or structural improvement or insulin-producing b-cells of pancreas. These significant healing effects towards pancreatic tissue can be explained by BN-associated regulation or nitric oxide and superoxide production by both tissue and circulating phagocytes. The mechanism of such regulation has to be elucidated further. On the other hand increased ROS production by tissue phagocytes did not cause oxidative damage to the pancreatic lipids. Therefore, structural and functional abnormalities of pancreas induced by STZ are not connected with lipid peroxidation and could be a consequence or oxidative damage to proteins and carbohydrates. One of the generalized reactions of the organism to STZ was an increased level of lipid peroxidation and decreased content of reducing glutathione in erythrocytes. Bio-Normalizer was shown to increase the level of GSH in erythrocytes and probably prevent them from the oxidative damage. It has been shown several times that erythrocytes of diabetic patients contained low levels or reduced glutathione which could be a causative reason for many vascular complications associated with diabetes mellitus.
CONCLUSION
1.
2.
3.
4.
REFERENCE
- Marietta. M.A.;Yoon. PS.; Iyengar. R.; Leaf. C.D.; Wishnok J.S. Macrophage oxidation of L-argininc to nitrite and nitrate: Nitric oxide as an intermediate. Biochemistry 27: 8706-8711 : 1988.
- Johnston. R.B.; Godzik. C.A.; Cohn. Z.A.; Increased superoxide anion production by immunologically acticvated and chemically elicited macrophagcd. J. Exp. Med. 148: 115-119; 197R.
- Andersen. H.J.; Chen. H.; Pellett. L.J.; Tappel. A.L.; Ferrous-iron-induced oxidation in chicken liver slices as mesured by hemichrome formation and thiobarbituric – reactive substance. Effect of diaetary vitamin E and Bcarotene. Free Radic. Biol. Med.15: 37-48: 1993.
- Tietze. F. Enzymic method for quantilative determination of nanogram amounts of total and oxidized glutathione applications to mammalian blood and other tissues. Anal. Biochem. 27: 502-5:22: 1969.
- 5. Kroncke. K.-D.; Fehsel. K.; Kolb-Bachoven. V. Nitric Oxide: cytotoxicity versus cytoprotection ·- how, why, when and where? Nitric Oxide biology and Chemistry 1997: 1:107-120.
Table 1. STZ and BN effects on luminol-dependent chemiluminescene (LDCL) in isolated peritotreal macrophage.
|
Experiment |
Agent, concenter. |
LDCL spontaneous (mV/106 cells) |
Zymosan-activated LDCL(mV/106 cells) |
|
Exper. 1 |
STZ, 2 mg/mL STZ + BN, 2 mg/mL |
98 ± 5 140 ± 6 85± 5 |
415 ± 63 217 ± 44 195 ± 15 |
|
Exper. 2 |
STZ, 2 mg/mL STZ + BN, 2 mg/mL |
27 ± 2 123± 14 31 ± 3 |
128 ± 11 51± 7 56±9 |
|
Exper. 3 |
STZ, 2 mg/mL STZ + BN, 2 mg/mL |
42± 1 128 :1 54± 6 |
1114± 14 746 ± 15 728 ± 18 |
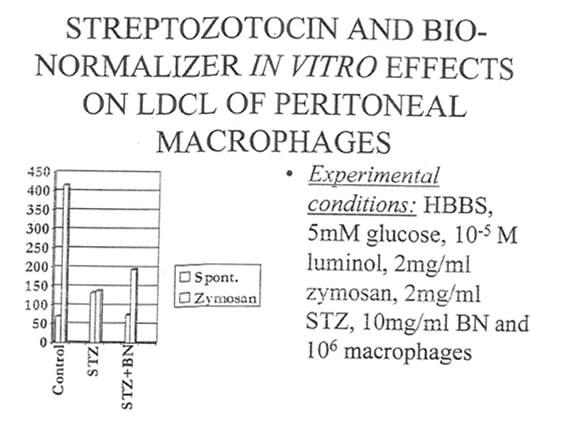
Table 2. Glucose content (mM/L.) in blood plasma
| Group | 3d day afterstreptozotocin injection | 10th day afterstreptozotocin injection |
| Control | 5.9 ±0.6 | 6.2 ±1.0 |
| STZ diabetes | 18.0±1.5* | 14.4±0.6* |
| Diabetes+ UioNormnliT.cr | 18.0±1.5* | 7.6 ±0.8 |
*- p < 0.0 I l’S control
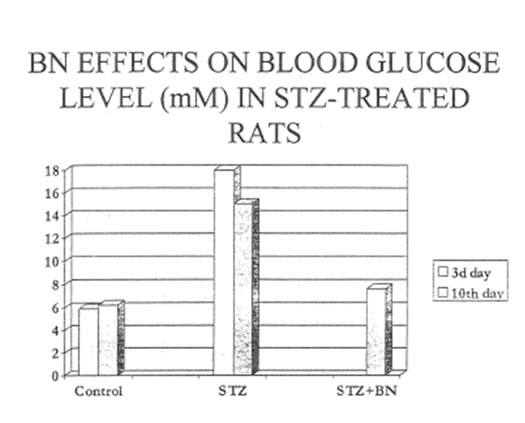
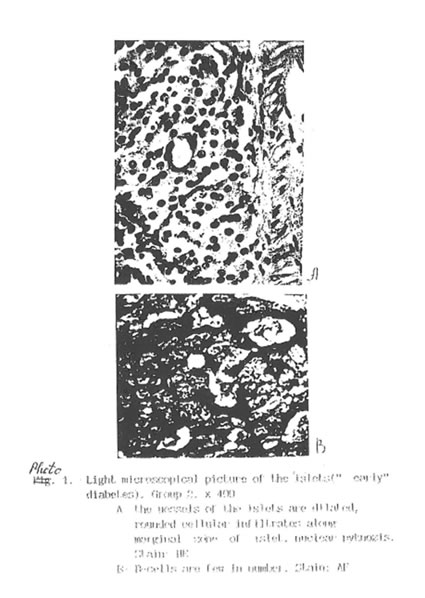
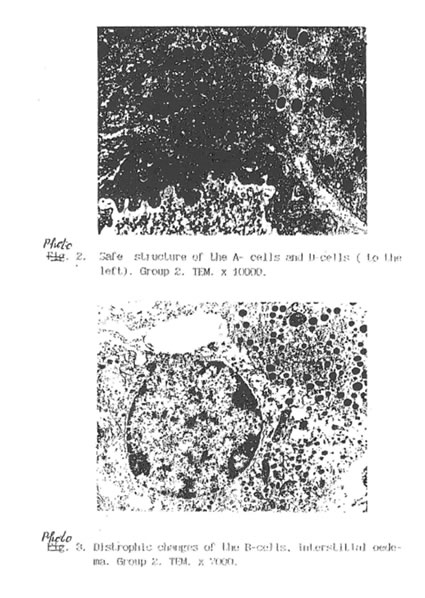
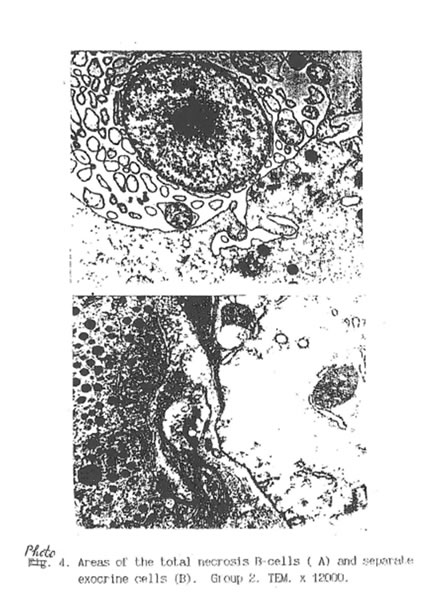
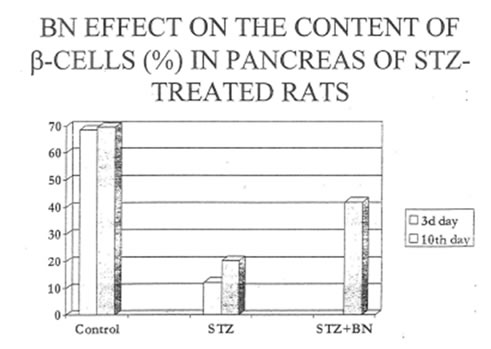
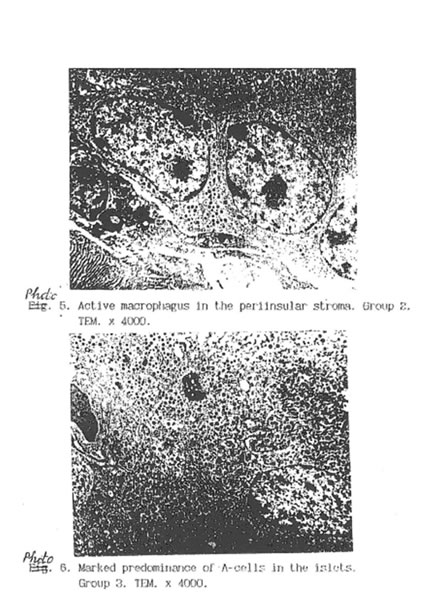
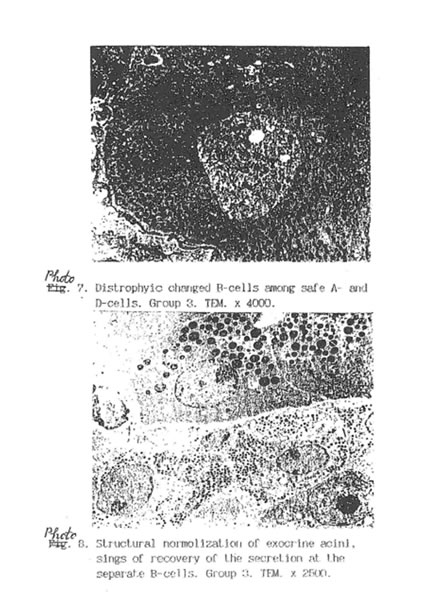
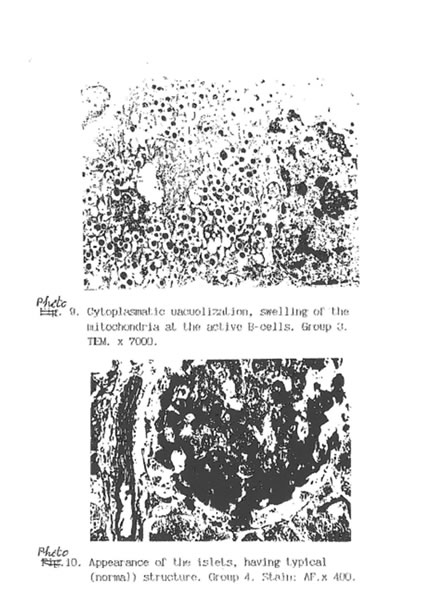
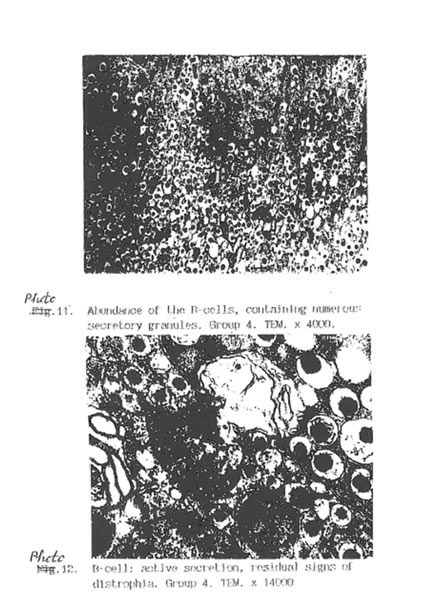
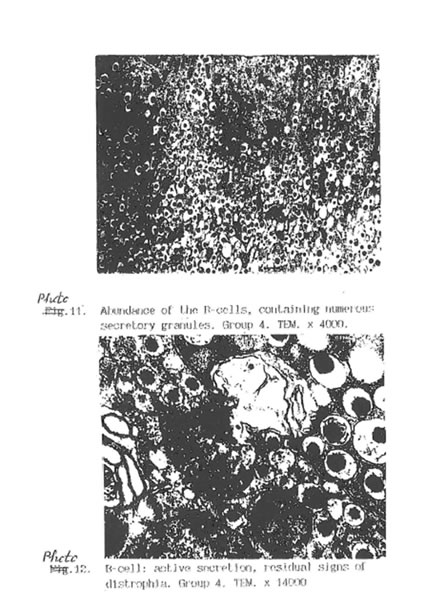
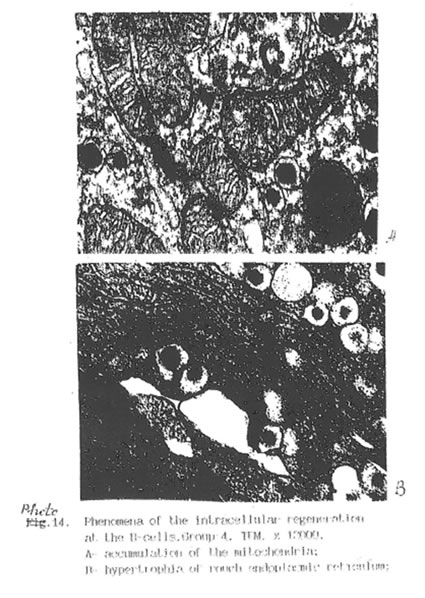
Table 3. Nitric oxide (NO) formation by PMA-activated peritoneal macrophages
|
Group |
3d day after STZ injection |
10th day after STZ injection |
||
|
NO (pmol/min/106 cells ) |
L-NAME inhibition (%) |
NO (pmol/min/106 cells ) |
L-NAME inhibition (%) |
|
|
Control |
15.7±2.3.0 |
41±17 |
22.1±2 |
50±11 |
|
Diabetes |
25.5±0.3* |
49±10 |
43.6±1.4* |
73±6 |
|
Diabetes + Bio-Normalizer |
N.A |
N.A |
28.8±2.8 |
100* |
*p <0.05
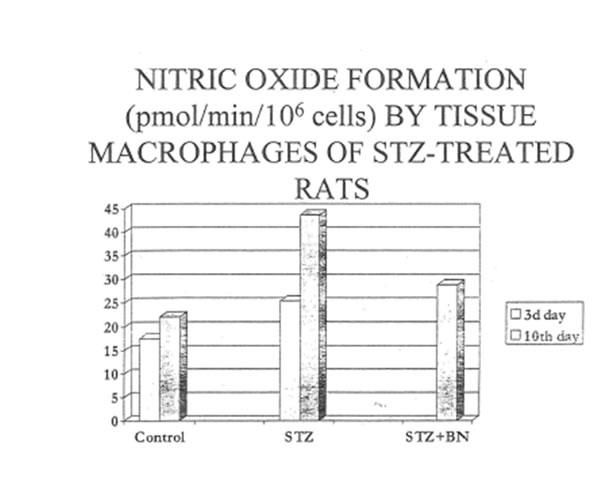
Table 4. Spontaneous and PMA-activated superoxide production (nmolO2-/1 hour/ 106 cells) by peritoneal macrophages of rats with STZ-induced diabetes.
|
Group |
3d day after STZ injection |
10th day after STZ injection |
||
|
Spontaneous |
PMA-activated |
Spontaneous |
PMA-activated |
|
|
Control |
210±3.3 |
962±67 |
340±22 |
986±45 |
|
Diabetes |
28.6±40* |
1086±99 |
448±38* |
1048±56 |
|
Diabetes + Bio-Normalizer |
N.A |
N.A |
432±19* |
1305±128* |
* p < 0.05 vs control
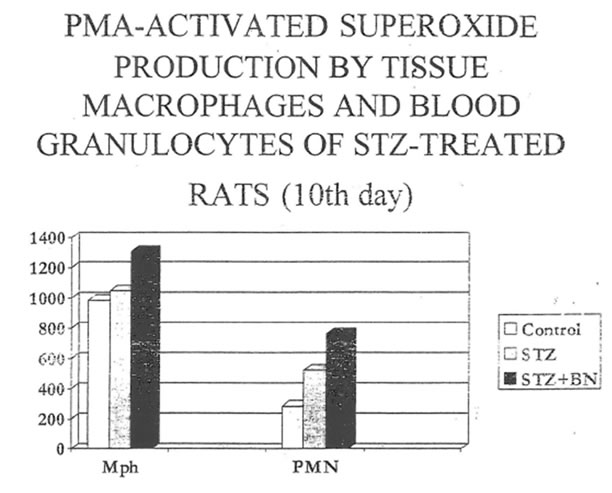
Table 5. Effects of L-arginine and L-NMMA on superoxide production by peritoneal macrophages of rats with STZ-induced diabetes (% of control)
|
Group |
Agent |
3d day after STZ injection |
10th day after STZ injection |
||
|
Spontaneous |
PMA-activated |
Spontaneous |
PMA-activated |
||
|
Control |
L-arginine L-NMMA |
100 122±10 41±5 |
100 64±7 148±8 |
100 117±16 28±4 |
100 85±7 146±10 |
|
Diabetes |
L-arginine L-NMMA |
100 107±18 7±3 |
100 54±4 107±9 |
100 74±16 5±1 |
100 82±4 108±9 |
|
Diabetes + Bio-Normalizer |
L-arginine L-NMMA |
100 107±18 7±3 |
100 54±4 107±9 |
100 110±7 10±4 |
100 95±2 144±10 |
Table 6. Nitric oxide (NO) formation by PMA-activated blood granulocytes
|
Group |
3d day after STZ injection |
10th day after STZ injection |
|
|
NO (pmol/min/106 cells ) |
NO (pmol/min/106 cells ) |
L-NAME inhibition (%) |
|
|
Control |
25.5±1.4 |
27.9±1.8 |
42±4 |
|
Diabetes |
0* |
13.9±1.4* |
24±1 |
|
Diabetes + Bio-Normalizer |
0* |
23.9±2.1 |
98±2* |
* p < 0.05
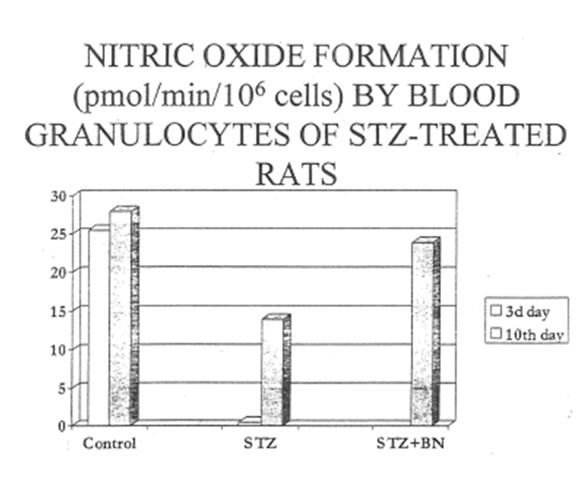
Table 7. Spontaneous and PMA-activated superoxide production (nmolO2-/ 1 hour / 106cells) by blood granulocytes of rats with STZ induced diabetes.
|
Group |
3d day after STZ injection |
10th day after STZ injection |
||
|
Spontaneous |
PMA-activated |
Spontaneous |
PMA-activated |
|
|
Control |
143±21 |
429±51 |
190±35 |
285±34 |
|
Diabetes |
129±40
|
667±39* |
167±42 |
523±59* |
|
Diabetes + Bio-Normalizer |
129±40 |
667±39* |
199±27 |
762±29* |
* p < 0.05 vs control
Table 8. Lipid peroxidation in liver, pancreas and red blood cell of rats with streptozotocin-induced diabetes
Liver
|
Group |
TBA reactive products (µM/g tissue) 3d day after streptozocin injection |
TBA reactive products (µM/g tissue) 10th day after streptozocin injection |
|
Control |
0.264 ± 0.035 |
0.223 ± 0.036 |
|
Diabetes |
0.173 ± 0.019* |
0.187 ± 0.051 |
|
Diabetes + Bio Normalizer |
0.173 ± 0.019* |
0.209 ± 0.059 |
* p < 0.05 vs control
Pancreas
|
Group |
TBA reactive products (µM/g tissue) 3d day after streptozocin injection |
TBA reactive products (µM/g tissue) 10th day after streptozocin injection |
|
Control |
0.14 ± 0.110/4 |
0.14 ± 0.029 |
|
Diabetes |
0.08 ± 0.004* |
0.07 ± 0.002 |
|
Diabetes + Bio Normalizer |
N.A* |
0.07± 0.003* |
* p < 0.05 vs control
Red blood cells
|
Group |
TBA reactive products (µM/g tissue) 3d day after streptozocin injection |
TBA reactive products (µM/g tissue) 10th day after streptozocin injection |
|
Control |
4.9 ± 0.6 |
5.1 ± 0.3 |
|
Diabetes |
8.2 ± 0.5* |
6.9 ± 0.8* |
|
Diabetes + Bio Normalizer |
8.2 ± 0.5* |
6.9 ± 0.3** |
* p < 0.01 vs control
**- p < 0.05 vs control
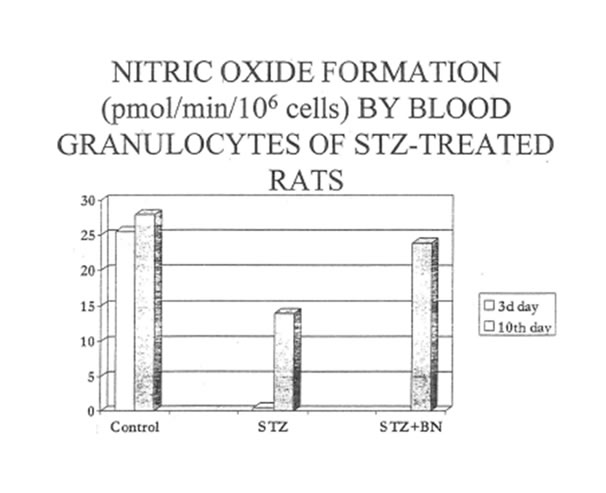
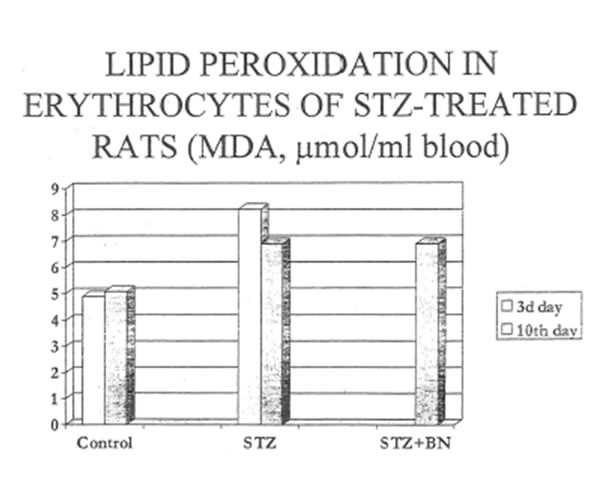
Table 8. GSH content in red blood cells of diabetic rats.
| Group |
GSH (µM/g Hb) 3d day after streptozocin injection |
GSH (µM/g Hb) 10th day after streptozocin injection |
| Control |
7.89 ± 0.33 |
8.30 ± 0.23 |
| Diabetes |
5.25 ± 0.67* |
6.76 ± 0.71* |
| Diabetes + BioNormalizer |
N.A* |
8.19 ± 0.40 |
*- p < 0.05 vs control