| Title | FREE RADICAL REGULATORY AND IMMUNOMODULATORY EFFECTS OF BIO-NORMALIZER |
|---|---|
| Year | 1995 |
| Author | James Akira Osato, Igor B. Afana’ev, Ljudmila Korkina, Librado A. Santiago, Akitane Mori, and Kazuhiro Takamizawa |
| Publisher | Nutrition, Lipids, Health and Disease |
Free Radical Regulatory and Immunomodulatory Effects of Bio-Normalizer
James Akira Osato,1,2 Igor B. Afana’ev,3 Ljudmila Korkina,4 Librado A. Santiago,1,5 Akitane Mori5, and Kazuhiro Takamizawa2
1 Osato Research Institute, Gifu 500, Japan
2 The United Graduate School of Agricultural Sciences, Gifu University, Gifu 500, Japan
3 Vitamin Research Institute, Moscow, Russia
4 Russian Institute for Pediatric Hematology, Moscow, Russia
5 Department of Neuroscience, Okayama University Medical School, Okayama 700, Japan
Introduction
Bio-Normalizer (BN) is a traditional natural Japanese health food exhibiting therapeutic effects on various human pathological states including tumors, allergy, inflammation, and immunodeficiency, among others (1). It is believed that very active hydroxyl and hydroxyl-like free radicals may be one of the major causes of various free radical pathologies. (2). Consequently, agents that can scavenge free radicals have been found to prevent the occurrence and progression of such disease conditions (3-7). The therapeutic and preventive action of such agents may be a consequence of the regulation and maintenance of a normal free radical status in organisms. It could be emphasized, however, that active oxygen species do not only exhibit deleterious effects, but also possess very important physiological properties. It has been shown that superoxide and hydrogen peroxide can defend an organism against exogenous bacterial intervention (8,9); serve as adaptogenes by inducing endogenous free radical defense systems (10); and stimulate growth, maturation, and differentiation in a variety of mammalian cells (11). It is known that hydroxyl radicals are the most aggressive agents capable of initiating irreversible damage (12,13). On the other hand, superoxide (O2.) and hydrogen peroxide can interfere with physiological processes and regulate them (14).
It is now well established that the most powerful source of oxygen species in mammalians is phagocytosing cells, such as circulating leukocytes and tissue macrophages (15,16). These species released from cells participate in tumor initiation and promotion (17), the destruction of blood circulating and endothelial cells (18), chromosome breakages (19), and ischemic reperfusion injuries (20), among others. Phagocytosing cells are thus commonly used to evaluate the free radical scavenging activity of substances.
The purported therapeutic activity of BN is thought to be a consequence of its free radical scavenging property. Indeed, it has been shown that BN diminished DMPO-OH spin adduct formation in the Fenton system and inhibited lipid peroxidation initiated by Fe+++ ions in rat cerebral cortex (1). BN has also exhibited an O2 quenching ability in the xanthine-xanthine oxidase system (1).
In this chapter, we report the effects of BN on free radical production in cell-free systems as well as its in vivo effects on oxygen radical production by inflamed and normal murine peritoneal macrophages and neutrophils. The chemiluminiscence (CL) method was applied for the detection of active oxygen species with the use of luminol and lucigenin amplifiers. The cytochrome c reduction method was used for the measurement of superoxide production.
Materials and Methods
Chemicals
BN is commercially produced by Sun-O International, Inc., Gifu, Japan. Its partly soluble white granules are prepared by the fermentation of Carica papaya, tropical herbal plants, and traditional Japanese foods. The granules contain yeast (1-5 x 10⁶ yeast cells/g), glucose (more than 2%), vitamins B and C, and papain proteases. Ferricytochrome c (type VIII), NADPH, lucigenin, luminol, menadione, zymosan A, latex (1 mm), phorbol myristate acetate (PMA), epinephrine, Ficoll-Paque, Monoprep, bovine serum albumin, Hanks’ balanced salt solution (HBSS), phosphate buffer, and bovine CuZnSOD (EC 1.15.1.1) were purchased from Sigma Chem. Co. (St. Louis, U.S.A.). Dextran sulfate and sodium metrizoate came from Pharmacia, Sweden.
Production of Active Oxygen Species in Cell-Free Systems
The production of active oxygen species were measured by luminol- and lucigenin-dependent CL in the following cell-free systems: (1) Fenton reaction, (2) xanthine + xanthine oxidase as a source of superoxide ion, (3) NaClO + H2O2 as a source of singlet oxygen, and (4) H2O2 + horseradish peroxidase (HRP) as a model of leukocyte myeloperoxidase-catalyzing reaction. All measurements were performed in 1 mL polystyrene CL tubes at 25oC with continuous mixing. After the reaction was started, the CL light sum was registered for 60 sec. Then the values obtained in the presence and absence of BN were compared, and the results were expressed as a percentage of CL inhibition. System 1 consisted of 0.1 mM xanthine and 10 mM lucigenin, with or without BN in 0.125 M Na2CO3 (pH 7.8). Reaction was initiated by the addition of 0.04 mg xanthine oxidase with the activity of 0.5 U/mg. Xanthine oxidase activity was assessed spectrophotometrically at 295 nm (21). Systems 2 and 3 contained 0.1 mM luminol and 1 mM NaClO or 0.12 mg HRP, respectively, with or without BN in 0.01 M tris-HCl buffer (pH 7.5). Reactions were started after adding through dispenser 1 mM H2O2. CL measurements were performed in triplicate and the results were expressed as a percentage of CL inhibition in the presence of BN.
Superoxide Production by Erythrocytes
This was detected by SOD-inhibitable cytochrome c reduction (22). Twenty-mL erythrocyte suspension, 50 mM cyt c, BN, or other free radical scavengers at appropriate concentrations were incubated in 2 mL 0.1 M potassium phosphate buffer with or without 10 mM menadione at room temperature for 60 min. After centrifugation, the light absorbance of clear supernatant was measured at 542 nm, 550 nm, and 557 nm (Beckman DU 600 spectrophotometer). To eliminate possible hemoglobin (Hb) absorbance, the amount of reduced cytochrome c was calculated with the following equation (22):
cyt c (red) = 47.6 A550 – 9.8 A557 – 31.8 A542
in which the extinction coefficients of reduced and oxidized cytochrome c and that of oxy Hb were taken into account. Data were presented as nmol O2–/60 min/1010 erythrocytes. Each measurement was performed in triplicate, and the results were expressed as a mean ± SD from 3-4 independent experiments.
Blood and Cell Isolation
Venous blood was obtained using disposable syringes from 5 healthy subjects from laboratory staff after informed consents have been secured. Blood was drawn in 2 mL amounts without any anticoagulant for serum preparation, and the next 2 mL blood were collected in heparinized tube (20 U Heparin/mL). Heparinized blood was carefully layered on 2 mL dextran metrizoate mixture (2.5 v/v) and incubated at room temperature for 30 min. Leukocyte-rich top layer was then placed on 1 mL Ficoll-Pague (p=1.119) and centrifuged at 400 x g for 30 min. Neutrophil containing pellet was washed twice in cold HBSS, and finally resuspended in Minimum Essential Medium (MEM). Cell content was adjusted to 3-5 x 10⁶ cells/mL. Cell suspension contained more than 95% neutrophils as confirmed by differential cell count using Coulter counter (France). A majority of the neutrophils obtained were viable (90-98%) as determined by trypan blue exclusion.
Animals
Two species of animal models were used in the experiments: adult male Wistar rats, and Balb/c mice weighing 18-20 g.
Macrophage Preparation in Wistar Rats
Experiments on Wistar rats were carried out under ethyl ether narcosis. Rats were injected intraperitoneally with 10 mL HBSS preheated to 37oC, and then sacrificed 5 min after injection. The peritoneal lavage fluid was removed and placed on the top of Monoprep solution (p=1.068). Samples were centrifuged at 400 x g for 30 min. The upper portion containing mononuclear cells was removed and washed twice with cold Ca-Mg-free HBSS. Washed cells were resuspended in MEM supplied with 1% heat-inactivated calf serum. The differential cell count was performed microscopically using Giemsa staining. About 80% of cells were macrophages and monocytes, with the rest being lymphocytes, mast cells, and erythrocytes.
In vivo Experiments in Balb/c Mice
Mice were divided into 4 groups. Group 1 (control, 6 animals) received an intraperitoneal injection of 0.1 mL sterile physiological solution. Group 2 (10 animals) received 12.5 mg BN saline suspension. Group 3 (8 animals) and Group 4 (11 animals) were injected with 0.5 mL 0.06% dextran sulfate solution; and 24 h later, the Group 4 mice were injected with 12.5 mg BN saline suspension. The mice were killed and examined on days 1,2,3, and 8 after the experiment had begun. The peritoneal exudate cells were collected by peritoneal washing with 2 mL saline solution, and their total number was calculated by staining them with 0.2% trypan blue and counting them in a Goryaev chamber. Differential cell counting was done on smears using Giemsa stain.
Neutrophil and Macrophage Preparation in Bal/c Mice
Murine neutrophils and macrophages were prepared by density gradient centrifugation using Ficoll-Hypaque (d=1.077) for neutrophil isolation and Monoprep (d=1.119) for macrophage isolation. Cells were collected and washed twice with Ca-Mg-free HBSS, and finally resuspended in MEM.
Macropage NADPH Oxidase Activity
The NADPH activity in Balb/c mice macrophage was determined by the method described in Reference (23). Cells at 107 were resuspended with 50 mM cytochrome c and 2 mM NaN3 (to prevent cytochrome c reoxidation by cytochrome c oxidase) in 1 mL HBSS, and placed in the 1-cm cuvette supplied with a stirrer of an LKB “Ultraspec” spectrophotometer at 37oC. Light absorbance was continuously recorded at 50 nm. The reaction was initiated by the addition of 10 ng/mL PMA, stopped at the maximal rate by 0.05% Triton 100 and restored 1 min later by the addition of NADPH at the appropriate concentration.
Production of Active Oxygen Species by Neutrophils and Macrophages
The production of active oxygen species by peritoneal phagocytes was measured by the CL method method using lucigenin as a specific CL probe for the detection of superoxide ion (24) and luminol as a CL probe for the detection of active oxygen species forming during hydrogen peroxide decomposition (25). In these experiments, 5 x 10⁵ cells were mixed in polystyrene CL tubes with 0.9 mL HBSS containing 50 mM luminol or lucigenin and BN at the appropriate concentrations. The tubes were placed in the CL unit of an LKB luminometer (model 1251, Sweden) equipped with a minicomputer for controlling experimental procedures and the calculation and expression of the data obtained. The cell-containing mixture was incubated at 37oC with continuous stirring for 5 min. During this time, CL intensity (spontaneous CL) was continuously registered. Then, 50 mL activator solution (opsonized zymosan, latex particles, or PMA) was automatically added through a dispenser, and the maximal intensity of CL response to the activator was measured (stimulated CL). Results were expressed in arbitrary CL units as well as percent of CL intensity in the presence of BN or the other free radical scavengers.
SOD Activity in the Whole Blood, Serum. Isolated Neutrophils, and Macrophages
Superoxide dismutase (SOD) activity was determined by the adrenaline method (26) in which the rate of superoxide production was measured by lucigenin-amplified CL. Heparinized blood (0.2 mL) or cell suspension (0.4 mL) was lyzed with ice-cold water. Lysates were added to the equal volume of ethanol:chloroform mixture (1:1 v/v) and centrifuged at 1500 x g for 30 min. Protein content in supernatant was determined by the Lowry method (27). To measure the total SOD activity, 50 mL top clear supernatant or 50 mL plasma were added to carbonate buffer (pH 10.2, total volume of 900 mL) containing EDTA (100 mM) and lucigenin (100 mM) in the poystyrene CL cuvette, and the level of basal CL was continuously registered. Reaction was initiated by adding 50 mL adrenaline (100 mM) through the dispenser. The CL light sum for 5 min. was recorded and compared with that of control sample (50 mL water:ethanol:chloroform solution (2:1:1 v/v/v)). The total SOD activity was calculated from a calibration curve using commercial SOD as a standard, expressed as ng/mg protein (for macrophage, neutrophil, and plasma SOD) and as mg/mg protein (for the whole blood).
Statistical Analysis
Results are presented as mean ±SD for a given number of experiments. Differences were analyzed using the Student’s t-test with the level of significance set at p<0.05.
Results
The scavenging activities of BN were measured in cell-free systems in which various active oxygen species were generated. Test results show that BN inhibited the production of active oxygen species in a concentration-dependent manner. (Fig.4.1). The concentration of 50% inhibition (IC50) were found to be equal to 0.4, 4.5, 1.6, and 2.5 mg/mL for the Fenton reaction, H2O2 + NaClO, the H2O2-HRP, and the xanthine-xanthine-oxidase systems, respectively. BN did not affect the xanthine oxidase activity within a wide concentration range (1-30 mg/mL).
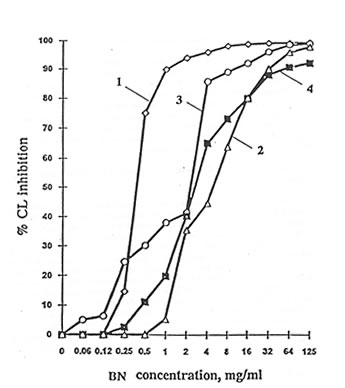
Fig. 4.1 Influence of Bio-Normalizer on active oxygen species production in cell-free systems: Groups (1) Fenton reaction, (2) NaClO + H2O2, (3) horseradish + H2O2, and (4) xanthine + xanthine oxidase.
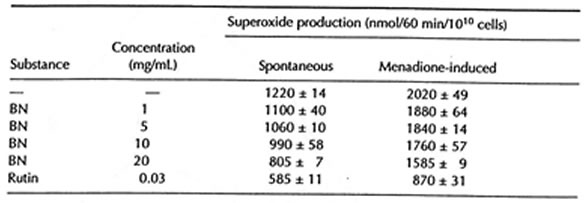
At the same time, however, BN exhibited weak inhibitory activity in erythrocyte suspension. Thus, maximal BN concentration (20 mg/mL) decreased spontaneous and menadione-induced superoxide release from erythrocytes by 22-34% (Table 4.1)
The cells of peritoneal exudate isolated from the mice injected with dextran sulfate enhanced levels of luminol- and lucigenin-amplified CL in comparison with the cells from control animals upon the stimulation by opsonized zymosan, latex particles, or PMA, with maximal values being achieved as early as the first and second day after dextran injection. BN administration to the mice resulted in significant changes in luminol- and lucigenin-amplified CL produced by latex- and PMA-stimulated peritoneal cells. BN, however, did not affect CL intensities in the case of zymosan stimulation. Accepting that the CL intensities are equal to the sum of macrophage and neutrophil contributions and knowing the amounts of recruited macrophages and neutrophils, we calculated the CL intensities produced by macrophages and neutrophils separately (Figs. 4.2 and 4.3). BN administration differently affected macrophage luminol- and lucigenin-amplified CL. Thus, at the end of the experiment, when neutrophil-produced CL was close to zero, lucigenin-amplified CL of PMA- and latex-stimulated macrophages from Group 4 mice were enhanced (Figs. 4.2A and 4.3B) while their luminol-amplified CL was inhibited (Figs. 4.2B and 4.3A). On the other hand, BN administration apparently shortened (at least in the case of PMA stimulation – Figs 4.2A and 4.2B) the duration of neutrophil CL. Because BN administration may decrease both the neutrophil population and the CL intensity produced by a single cell, we studied its effects on neutrophils and macrophages separately after the isolation of cells from healthy animals (Group 2). Figures 4.4A and 4.4B show that BN administration sharply increased, up to 200-400%, both the luminol- and lucigenin-amplified CL produced by non-stimulated and PMA-stimulated macrophages and inhibited down to 25-75% the neutrophil-produced CL. The stimulation of cells with latex particles and opsonized zymosan obtained similar results (data not shown).
TABLE 4.1 Effects of Bio-Normalizer on Spontaneous and Menadione-Induced Superoxide Production by Human Erythrocytes
NADPH oxidase activity of peritoneal macrophages from mice injected with dextran (Group 3) changed from 1.8 nmol O2–/min/106 cells to 3.1 nmol O2–/min/106 cells within the 8-d period (Fig. 4.5). The administration of BN to Group 4 mice enhanced the NADPH oxidase activity by about 1.4 times on the second day of inducing inflammation. But toward the end of the experiment, NADPH oxidase activity was reduced to a level even lower than that of macrophages from the mice not receiving BN treatment (Group 3).
A significant increase in SOD activity was observed in peritoneal macrophages on the seventh day of BN application (Fig. 4.6). On the other hand, there was no change in the SOD activity in the whole blood and serum or in peritoneal neutrophils.
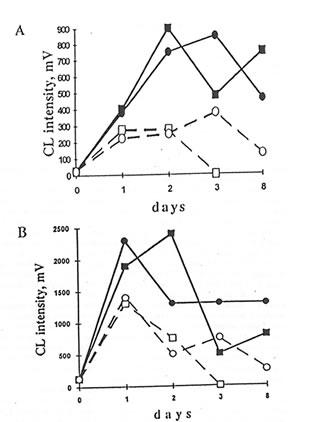
Fig. 4.2 Effects of Bio-Normalizer administration on dextran-injected mice on lucigenin- (A) and luminol- (B) amplified chemiluminiscence (CL) produced by peritoneal macrophage and neutrophil. 5 x 10⁶ cells were incubated with 50 mM luminol or lucigenin in 0.9 mL HBSS at 37oC for 5 min. Then 50 mL PMA solution was added, and the maximal CL response to a stimulus was registered (=) and g are the points corresponding to CL intensities produced by the inflamed macrophage without and with Bio-Normalizer application (Group 3 and 4, respectively). m and q are the values that correspond to CL intensities produced by neutrophil.
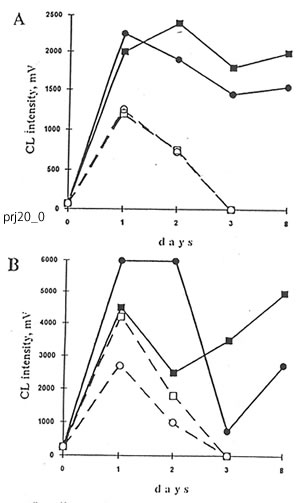
Fig. 4.3. Effects of Bio-Normalizer on dextran-injected mice on luminol- (A) and lucigenin- (B) amplified CL produced by peritoneal macrophage and neutrophil. The experimental conditions and symbols are the same as in Fig. 4.2, except for the use of latex as a stimulus instead of PMA.
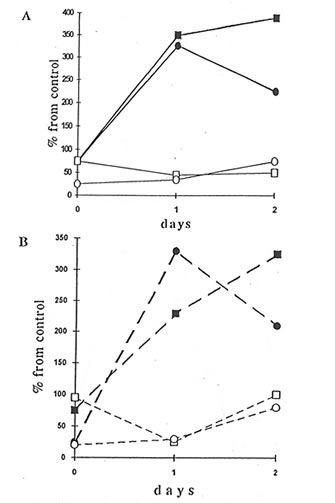
Fig. 4.4. Effects of Bio-Normalizer on healthy mice on spontaneous luminol- (A) and lucigenin- (B) amplified CL produced by the peritoneal macrophage and neutrophil. The experimental conditions and symbols are the same as in Fig. 4.2.
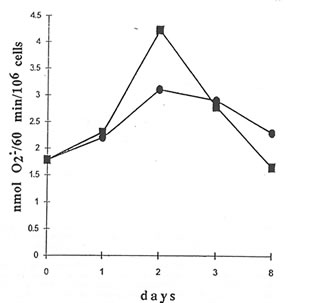
Fig. 4.5. Effects of Bio-Normalizer on NADPH oxidase activity in peritoneal macrophage of dextran-injected mice. = without Bio-Normalizer, g with Bio-Normalizer administration of Group 3 and 4, respectively. 107 cells were resuspended in 1 mL HBSS with 50 mM cytochrome c and 2 mM NaN3. The reaction was started by adding 10 ng/mL PMA, stopped at the maximal rate by 0.05% Triton 100, and restored 1 min later by adding NADPH.
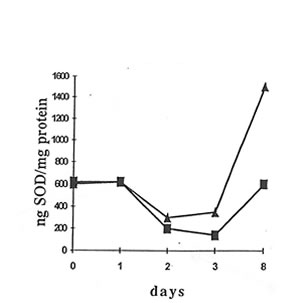
Fig. 4.6. Effects of Bio-Normalizer on superoxide dismutase activity in macrophage of dextran-injected mice. g without Bio-Normalizer, 5with Bio-Normalizer administration.
Discussion
Biologically active substances can affect oxygen radical production by cells in different
pathways: interacting directly with active oxygen species produced by cellular enzymes; interfering with some stages of activation process of the plasmalemmal NADPH oxidase; and/or changing membrane-bound NADPH oxidase activity. Thus, the level and rate of production of active oxygen species can be detected in the cell environment as well as in the intracellular space. BN is a complex mixture of biologically-active components (yeast cells, glucose, antioxidant enxzymes, and amino acids, among others) (1). It is therefore not surprising that BN is able to influence the oxygen radical production in cellular systems by different pathways
As Figure 4.1 shows, BN can inhibit the production of superoxide by xanthine oxidase and the formation of other active oxygen species by the Fenton reaction, H2O2 + NaClO, and H2O2 + HRP systems. In a previous study (1), the hydroxyl radical-scavenging activity of BN was clearly demonstrated. However, in the same experiment, the effect of BN on superoxide production was not clearly established using the ESR-spin trapping technique. In this report, the use of a more sensitive and a relatively more specific lucigenin-amplified CL method made it possible to demonstrate the superoxide-scavenging property of BN.
Because lucigenin-amplified CL is a highly specific test to analyze superoxide production (24) and the luminol-amplified CL characterizes the production of active oxygen species during hydrogen peroxide decomposition (25), it is possible that BN administration not only enhances superoxide production by macrophages but also decreases the production of very active oxygen species such as hydroxyl and hydroxyl-like radicals that are reacting non-specifically with any cellular component. Simultaneously, BN inhibits all kinds of oxygen radical production by neutrophils, thus suppressing leukocyte-mediated damage at the inflammatory loci.
A possible explanation for the diverse effects of BN administration on macrophages and neutrophils is that BN is able to increase (about 1.4 times) macrophage NADPH oxidase activity, as Figure 4.5 shows. But, such activity rapidly declined. This finding, on the other hand, can explain neither the 300-500% increase in oxygen radical production by macrophages in healthy mice (Fig. 4.4) nor the enhancement of lucigenin-amplified CL produced by inflamed macrophages on the eighth day (Figs. 4.2 and 4.3).
We propose that the in vitro stimulatory effect of BN on oxygen radical production by macrophages may originate from their interaction with T-lymphocytes. It has been shown previously that macrophages primed with yeast polysaccharides can interact with T-lymphocytes thus enhancing their interferon-g (IFN-g) production (28). Interferon-g, in turn, primes stimulated macrophages to increase oxygen radical release (28,29). As BN contains yeast cell particles and yeast cell wall components, they may be responsible for the BN stimulatory effect on macrophages. On the other hand, the antioxidant properties of BN are apparently responsible for the inhibition of neutrophil oxygen radical production (1), while in the case of macrophages, the BN stimulatory effect apparently prevails over its antioxidant activity.
It is possible that the difference in the in vivo effects of BN on luminol-amplified CL produced by normal and in the in vivo effects of BN on luminol-amplified CL produced by normal and inflamed macrophages is not accidental. We have shown earlier that some oxidative stress-initiated disorders (hereditary diseases such as Fanconi anemia [30] or those induced by exposure to low-dose radiation [31]) increased the production of active hydroxyl or hydroxyl-like radicals by phagocytes. If it is also true for inflamed macrophages, then the inhibition by BN of their luminol-amplified CL is explained by the BN hydroxyl radical scavenging properties.
We also found that BN stimulated the induction of SOD in macrophages (Fig. 4.6) and not in neutrophils, protecting only the first ones from damaging action of oxygen radicals released. It is well known that severe oxidative stress plays an important role in the pathogenesis of many diseases and is likely to contribute directly to the tumor initiation and promotion (32). On the other hand, moderate oxidative stress is responsible for the rapid induction of humerous gene products which are thought to serve as adaptogens to the oxidative stress. Among these adaptogens are SODs, catalase, DNA repair enzymes, etc. (32). Therefore, SOD is defined as a very important endogenous antitumor agent (33).
Thus, our findings suggest that under the in vivo conditions BN exhibits a double effect: BN decreases PMN leukocyte prooxidant activity at inflammatory loci protecting neighboring tissues against oxidative damage, and on the other hand, BN stimulates phagocytosing activity, oxygen radical production, and possible some other functions of mononuclear phagocytes, which are likely to be major cells responsible for mammalian antitumor immunity.
References
- Santiago, L.A., Osato, J.A., Hiramatsu. M., Edamatsu, R., and Mori, A. (1991) Free Radical Biol. Med. 11, 379-383.
- Korkina, L.G., Samochatova, E.V., Maschan, A.A., Suslova, T.B., Cheremisina, Z.P., and Afanas’ev, I.B. (1992) J. Leukocyte Biol. 52, 357-362.
- Perchellet, J.P., and Perchellet, E.M. (1989) Free Radical Biol. Med. 7, 377-408.
- Simpson, P.J., and Luccheci, B.R. (1987) J. Lab. Clin. Med. 110, 13-30.
- Lesnefsky, E.J. (1992) Free Radical Biol. Med. 12, 429-446.
- Vapaatalo, H. (1986) Med. Biol. 64, 1-7.
- Ames, B.N. (1983) Science 221, 1256-1264.
- Babior, B.M., Kipnes, R.F., and Kurnutte, J.T. (1973) J. Clin. Invest. 58, 741-749.
- Forman, H.J. , and Thomas, N.J. (1986) Ann. Rev. Physiol. 48, 669-680.
- Davis, J.M.S., Yelich, L.L., Lowry, C.V., Davies, K.J.A. (1993) Free Radical Biol. Med. Oxygen 93, 1st Ann. Meet of the Oxygen Society, 504.
- Hamilton, J.A., Veis, N., Bordun, A.M., Vario, G., Gonda, T.J., Philips, W.A. (1989) J. Cell Physiol. 111, 618-626.
- Trush, M.A., and Kensler, T.W. (1991) Free Radical Biol. Med. 10, 201-209.
- Halliwell, B., and Gutteridge, J.M.C. (1998) ISI Atlas Sci. Biochem. 1, 48-52.
- Burdon, R.H. (1992) Proc. Royal Soc. Edinburg. 99B, 169-176.
- Drath, D.B., and Karnovsky, M.L. (1975) J. Exp. Med. 141, 257-262.
- Babior, B.M. (1984) J. Clin Invest. 73, 599-601.
- Weitzman, S.A., Weitberg, A.B., Clark, E.P., Stossel, T.P. (1985) Science 227, 1231-1233.
- Balla, G., Vercellotti, G.M., Muller-Eberbard, U., Eaton, J., and Jacobs, H.S. (1991) Lab. Invest. 64, 648-655.
- Jackson, J.H., Gajewski, E., Schraufstatter, I.U., Hislop, P.A., Fuciarelli, A.F., Cockrane, C.G., and Dizdaroglu, M. (1989) J. Clin. Invest. 84, 1644-1649.
- Werns, S.W., Shea, M.J., and Luccheci, B.R. (1985) Free Radical Biol. Med. 1, 103-110.
- Fridovich, I. (1985) In Handbook of Methods for Oxygen Radical Research, Greenwald, R.A., Boca Raton, CRC Press, pp.51-53.
- Grinberg, L.N., Shalev, O., Goldfarb, A., and Rachmilewitz, E.A. (1992) Biochem. Biophys. Acta 1139, 248-250.
- Bellavite, P., Jones, O.T.C., Cross, A.R., Papini E., and Rossi, F. (1984) Biochem. J. 223, 639-648.
- Gyllenhammar, H. (1987) J. Immunol. Methods. 97, 209-214.
- Allen, R.C., and Loose, L.D. (1976) Biochem. Biophys. Res. Commun. 69, 245-254.
- Misra, H., and Fridovich, I. (1972) J. Biol. Chem. 247, 3170-3175.
- Lowry, O.H., Rosebrough, N.J., Farr, A.L., and Randall, R.J. (1951) J. Biol. Chem. 193, 265-275.
- Ito, M., Karmali, R., and Krim, M. (1985) Immunology 56, 533-541.
- Afanas’ev, I.B. and Diplock, A.T. (1991) Superoxide Ion: Chemistry and Biological Implications, Boca Raton, CRC Press, vol. 2, p. 106.
- Korkina, L.G., Samochatova, E.V., Maschan, A.A., Suslova, T.B., Cheremisina, Z.P., and Afanas’ev, I.B. (1992) J. Leukocyte Biol. 52, 357-362.
- Korkina, L.G., Afanas’ev, I.B., and Diplock, A.T. (1993) Biochem. Soc. Trans. 21, 314S.
- Oberly, C.W. and Buetner, G.R. (1979) Cancer Res. 39, 1140-1149.
- Sun, Y. (1990) Free Radical Biol. Med. 8, 583-590.