| Title | ANALYSIS OF BIO-NORMALIZER PROTEINS BY CAPILLARY ELECTROPHORESIS |
|---|---|
| Year | 1997 |
| Author | Randolph Scott, Jr., James Akira Osato, Ph.D. Librado A. Santiago, Ph.D.2 Kazuhiro Takamizawa, Ph.D.3 |
| Publisher | Research Report |
ANALYSIS OF BIO-NORMALIZER PROTEINS BY CAPILLARY ELECTROPHORESIS
Randolph Scott, Jr.1,2
James Akira Osato, Ph.D.2
Librado A. Santiago, Ph.D.2
Kazuhiro Takamizawa, Ph.D.3
1 Center for Cooperative Research, Gifu University, 1-1 Yanagido, Gifu City 500, Japan
2 Osato Research Institute, 12 Bairin, Minami-machi, Gifu 500, Japan
3 Department of Bioprocessing, Faculty of Agriculture, Gifu University, 1-1 Yanagido, Gifu City 500, Japan
ABSTRACT
The use of capillary electrophoresis (CE) methods for analyzing Bio-Normalizer proteins was investigated. Trichloroacetic acid-precipitated proteins of Bio-Normalizer were subjected to both capillary electrophoresis sodium dodecyl sulfate (molecular sieving) (CE-SDS) as well as capillary isoelectric focusing (CIEF). Four protein peaks were separated from CE-SDS method while a major and a minor protein peak were focused using CIEF method. Based on the rapid, high-sensitivity, and reproducibility of capillary electrophoresis methods as well as the availability of detection and automated fraction collection facilities, CE-SDS and CIEF method can be used not only for separation but also for preparation of Bio-Normalizer proteins for sequencing analysis.
Keywords: Capillary electrophoresis (CE), capillary electrophoresis-sodium dodecyl sulfate (CE-SDS), capillary isoelectric focusing (CIEF), Bio-Normalizer proteins
1. INTRODUCTION
Bio-Normalizer is a natural fermented functional food product which has been discovered to have both free-radical regulating and immunomodulating properties(1,2,3,4) as well as other biological activities(5,6,7,8) which may help improve quality of life, and it is a popular as a health food regimen in Japan and some parts of the world. As a naturally fermented food product, the main components responsible for the biological activities of Bio-Normalizer have not yet been fully recognized and are believed to be composed of enzymes and other proteins. And so, work on the elucidation of Bio-Normalizer’s biochemical composition, particularly its proteins and enzymes, is currently under way.
Some of the protein components of Bio-Normalizer were separated recently using conventional methods such as isoelectric focusing (IEF) coupled with second dimension sodium dodecyl sulfate polyacrylamide gel electrophoresis (2-D SDS-PAGE) and were partially identified by N-terminal amino acid sequencing (9). But these conventional methods were quite tedious to perform and difficult to replicate and the artifacts produced during staining of gels made it difficult to assess how many kinds of proteins were actually present in Bio-Normalizer. Thus, a method for rapid and reproducible means of separation and detection was sought after.
Capillary electrophoresis (CE) is a relatively new method for analyzing proteins as well as other substances using narrow inside diameter capillaries (25-100mm) at high field strengths (hundreds of volts per centimeter). Advantages from using very small capillaries are high separation efficiency, rapid analysis time, and the flexibility of detection and automated fraction collection capabilities (10). Recent developments in CE technology have provided rapid and highly-resolving capillary electrophoretic means for analyzing protein components in food such as milk (11).
The use of CE for the analysis of the protein components of Bio-Normalizer was investigated in this initial study.
2. MATERIALS AND METHODS
2.1 Samples
Bio-Normalizer was obtained from Sun-O International Inc. (21 Imakomachi, Gifu 500, Japan) in 3 g sachets. Only one box containing 30 sachets of Bio-Normalizer was used in order to maintain the consistency of the results.
2.2 Materials
All reagents used were of high quality and only special Bio-Rad buffers, reagents and capillaries for use with the Bio-Rad Bio-Focus 3000 Capillary Electrophoresis System (Bio-Rad Laboratories, Tokyo, Japan) were purchased.
2.3 Protein Precipitation
A total of 100 mg of Bio-Normalizer powder was dissolved in 1 ml SDS-solubilizing buffer composed of the following: 10 mM Tris-HCl pH 8.0, 0.3% SDS, and 2.5% mercaptoethanol. Samples were completely dissolved and boiled at 100oC for 10 minutes and then centrifuged at 15,000 rpm at room temperature to remove undissolved particles. The resulting supernatant was cooled in ice and was added ice-cold trichloroacetic acid (TCA) to a final concentration of 10% and the mixture was incubated in 0oC for 1 hr. Afterwards, the mixture was centrifuged at 15,000 rpm at 0oC for 15 min. The resulting crude protein precipitate was washed twice with ice-cold diethyl ether twice and dried in vacuum. Samples of protein were kept at –20oC prior to analysis.
2.4 SDS-Complexed Proteins Sample Preparation
For capillary electrophoresis dynamic sieving of sodium dodecyl sulfate-complexed proteins (CE-SDS), precipitated proteins from a total of 500 mg original Bio-Normalizer powder were dissolved in 100 mL Bio-Rad CE-SDS protein sample buffer (2x concentration) and 100 mL deionized water with a final 2.5% mercaptoethanol concentration. Bio-Rad CE-SDS protein six standards (20 mg/ml protein) at 10 mL was added with 10 mL Bio-Rad CE-SDS internal reference standard, 100 mL Bio-Rad CE-SDS protein sample bufer and 80 mL deionized water. Both mixtures were boiled for 10 min at 100oC and kept at 4oC prior to use.
2.5 Capillary Isoelectric Focusing Sample Preparation
Proteins from 500 mg Bio-Normalizer were dissolved in 50 ml 8M urea containing 2% nonidet P-40 and 1% dithiothreitol and incubated at 37oC for 1 hour. One volume of 2% Bio-Rad Biolyte 3-10 mixture to a total final 1% ampholytes and 0.354% TEMED and 0.2% methyl cellulose concentrations was added to make the final sample for CIEF. A total of 10 ml Bio-Rad IEF standards was mixed with 490 ml Bio-Rad Biolyte 3-10 to make CIEF standards.
2.6 Capillary Electrophoresis
Two methods, CE-SDS and CIEF, were carried out using a Bio-Rad Bio-Focus 3000 Capillary Electrophoresis System controlled by a AST Bravo MS5133 computer running on Microsoft Windows 3.11 with the Bio-Rad Focus and Spectra v.3.01 software (Bio-Rad Laboratories, Tokyo, Japan). For the two analyses, only one type of column, 24 cm length x 50 mm inner diameter (i.d.) Bio-Rad user-assembled non-coated capillary, was used. CE-SDS was performed at 15 kV at 220 nm absorbance (Abs) with positive to negative polarity for 15 min at 20oC with 100 psi*sec sample injection while CIEF was performed at 15kV at 280 nm Abs using positive to negative polarity for 30 min focusing a mobilization time at 27oC 20 secs sample injection at 100 psi. All samples and reagents used were centrifuged at least 5 mins prior to analysis to avoid clogging the columns with non-dissolved particles. CE-SDS and CIEF runs were performed at least three times using the same buffers and reagents to check the reproducibility of the peaks.
2.7 Data Analysis
High speed scanning of wavelength from 200 to 380 nm was used and spectral analysis was generated on both CE-SDS and CIEF methods. Determination of peak migration time for the calibration of molecular weights and isoelectric points (pI) for CE-SDS and CIEF, respectively was done using the BioFocus Integrator software (Bio-Rad Laboratories, Tokyo, Japan).
3. RESULTS
The separation of TCA-precipitated proteins from Bio-Normalizer using CE-SDS methods and CIEF showed two distinct electropherograms (Figures 1 and 4).
The CE-SDS electropherogram in Figure 1 showed at least two types of proteins peaks resolved corresponding to peaks A (MW out of calibration range) and B (MW 14.5kD) as detected at 220 nm Abs. MWs were computed based on their migration time (tm) as compared with a calibration curve of the tm of the protein size standards (data not shown).
High speed scanning was also performed in order to check whether other protein peaks detected at other wavelengths were present. Figure 2 shows the projection of the Abs at different wavelengths from 200 nm to 380 nm showing that another protein peak, C (MW out of calibration range) can be detected at wavelengths lower than 220 nm.
The peak corresponding to B was observed to have a shoulder which was inferred to be another protein peak and so the electromigration procedure was slightly modified by decreasing the voltage from 15 to 9 kV, increasing the tm for the main peak and the shoulder to separate. Based on the electropherogram on Figure 4 with increased tm, the main peak B was resolved to at least two peaks corresponding to B (MW 14.5 kD) and D (MW not determined). The total number of major protein peaks that were obtained with the CE-SDS separation of Bio-Normalizer proteins was 4 which was lower than the amount reported by 2-D SDS-PAGE data previously obtained (9).
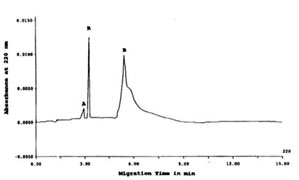
FIGURE 1. CE-SDS of TCA-precipitated Bio-Normalizer proteins detected at 220 nm. Peaks A and B were proteins peaks while R was a reference standard (benzoic acid). CE-SDS
conditions: 24 cm length x 50 mm i.d., -/+15 kV for 15 min at 20oC, detection at 220nm, and injection of 100 psi*sec.
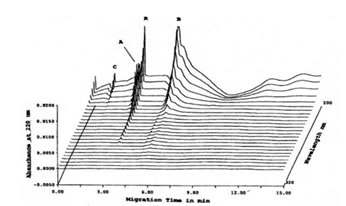
FIGURE 2. High-speed scanning at different wavelengths of CE-SDS of TCA-precipitated Bio-Normalizer proteins. Using absorbance other than 220 nm, protein peak C, aside from protein peaks A and B, was also detected. Peak R was a reference standard (benzoic acid). CE-SDS conditions: 24 length x 50 mm i.d., -/+15 kV for 15 min at 20oC, detection at 200-380 nm, and injection of 100 psi*sec.
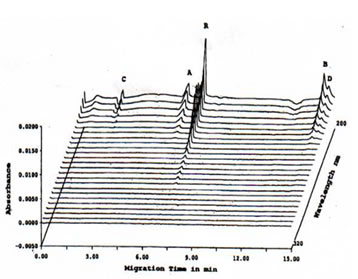
FIGURE 3. High-speed scanning detection of CE-SDS of TCA-precipitated Bio-Normalizer proteins. Prolonged migration time was performed by decreasing the voltage from 15 to 9 kV in order to separate protein peak B from its shoulder. Thus, protein peak D, aside from protein peaks A, B, and C, was detected. CE-SDS conditions: 24 cm length x 50 mm i.d., -/+15 kV for 15 min at 20oC, detection at 200-380 nm, and injection of 100 psi*sec.
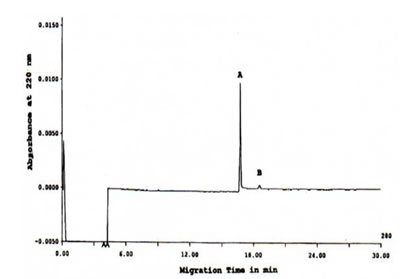
FIGURE 4. CIEF of TCA-precipitated Bio-Normalizer proteins detected at 280 nm. Major peak A and minor peak B was focused. CIEF conditions: 24 cm length x 50 mm i.d., +/- 15 kV for 30 min at 27oC, detection at 280 nm, and injection of 20 sec 100 psi.
On the other hand, using the CIEF method, an electropherogram on Figure 4 was generated which indicated that only a single major peak and a minor peak were resolved from the TCA-precipitated Bio-Normalizer proteins. Based on tm of the pI standards (data not shown), the major and minor protein peaks corresponded to pI of 8.2 and 7.8, respectively.
When checked against different absorbance wavelengths by high speed scanning, there was no other peak corresponding to another tm so it would seem that there is only one major and one minor protein resolved from crude protein precipitate of Bio-Normalizer using the CIEF method (data not shown). Based on the observation of precipitates obtained after centrifugation of samples prior to analysis by CIEF, most major proteins probably were not completely solubilized using the the present urea solution. This might be the reason why only one major peak was observed with CIEF using the same amount of proteins analyzed as that of the CE-SDS method.
4. DISCUSSION
The CE methods such as CE-SDS and CIEF in this preliminary study were performed in order to evaluate the use of CE as a tool for separation and detection of protein components from Bio-Normalizer for subsequent characterization of its protein components using N-terminal amino acid sequencing and mass spectrometry methods. As observed from the speed of analysis as well as the availability of a more accurate means of detection through high-speed UV scanning, proteins can be identified without problems of artifact staining and other related difficulties observed with Bio-Normalizer samples. However, methods for protein extraction and solubilization will have to be optimized in order to assess whether other proteins were not resolved due to precipitation of samples before application on the capillary columns since the procedures require centrifugation of precipitates in the samples in order to avoid clogging the capillary columns. The separation methods of CIEF and CE-SDS can be used with the automated fraction collection features already available in recent commercial models of capillary electrophoresis systems. Thus, the CE-SDS and CIEF methods can be used not only for separation of proteins from Bio-Normalizer but also for separation of protein samples for protein sequencing analysis.
5. REFERENCES
(1) Osato, J.A., Cuadra, M.S., and L.A. Santiago. (1995a). Antioxidant Defenses of Bio-Normalizer. Magnetic Resonance Med. 6, 306-308.
(2) Santiago, L.A., Osato, J.A., Hiramatsu, M., and A. Mori. (1991a). Free-Radical Scavenging Action of Bio-Catalyzer a.r No.11 (Bio-Normalizer) and its By-Product. Free Radical Biol. Med. 11, 379-383.
(3) Santiago, L.A., Osato, J.A., Hiramatsu, M., and A. Mori. (1992d). Bio-Catalyzer a.r No.11, Bio-Catalyzer 2B, Bio No.66 Quenched Free Radicals and Inhibited Lipid Peroxidation in Iron-Induced Epileptic Focus in Rats. In: Yagi, K., Kondo, E., Niki, E., and T. Yoshikawa. [eds]. Oxygen Radicals. Elssevier Science Publishers B.V., Netherlands. pp. 405-408.
(4) Osato, J.A., Afanas’ev, I.B., Korkina, L.G. Santiago, L.A., Mori, A. and K. Takamizawa. (1995c). Free Radical Regulatory and Immunomodulatory Effects of Bio-Normalizer. In: Ong A.S.H., Niki, E and Packer, L. [eds.] Nutrition: Lipids, Health and Diseases. AOCS Press. Illinois. pp. 45-58.
(5) De Castro-Bernas, G., Abrigo, R., Remo, G., San Miguel, M., Osato J.A., Santiago, L.A. and A. Mori. (1993a). Antigenotoxic Potential of Bio-Normalizer of Bio-Catalyzer a.r No.11 (Bio-Normalizer) Against Somatic Cell Genotoxic Agents. Med. Sci. Res. 21, 107-108.
(6) De Castro-Bernas, G., Abrigo, R., Remo, G., San Miguel, M., Osato J.A., Santiago, L.A. and A. Mori. (1993b). The Biological Activities of Bio-Catalyzer a.r No.11 (Bio-Normalizer). In: Trends in Traditional Medicine Research. Kit Lam [ed.]. School of Pharmaceutical Sciences, Penang, Malaysia. pp. 366-376.
(7) Okuda, H., Ominami, H., Zhou, A., Matsuura, Y., Osato, J.A., and L.A., Santiago. (1993). Studies on the Biological Activities of Bio-Normalizer. Clinical Report. 27, 4249-4258.
(8) Osato J.A., De Castro-Bernas, G., Remo, G., San Miguel, M., Urbano, G., Abrigo, M.R.B., Santiago, L.A. and K. Takamizawa. (1994). Antimicrobial Potential of Bio-Catalyzer a.r No.11 (Bio-Normalizer) Against Enteric Microrganisms. Acta Manilana. 42, 9-14.
(9) Osato J.A. (1995). Biologocal Activity of Fermented Papaya Product. Ph.D. Thesis. United Graduate School of Agricultural Science, Gifu University Science of Biological Resources, Gifu University.
(10) Grimm, R. (1997). Automated Fraction Collection in Capillary Electrophoresis. In: Handbook of Capillary Electrophoresis Applications. Shintani, H., and J. Polonsky [ed.]. Blackie Academic and Professional. Tokyo. pp. 128-136.
(11) Cattaneo, T.M.P., Nigro, F., and G.F. Greppi. (1996). Analysis of Cow, Goat and Ewe Milk Mixtures by Capillary Zone Electrophoresis (CZE): Preliminary Approach. Milchwissenschaft 51(11), 616-618.
ACKNOWLEDGEMENT
We would like to express our deep appreciation for Ms. Izumi Inoko’s assistance in the experiments